

Have you ever created a Date Level swap (Drill down/up from Year-> Month, etc), and got irritated that the bar chart widths never looked great? Sure we can change the Date to Discrete, and do some other stuff, but it's still not what we want, it's not pixel perfect.
Well, I have the solution!
Step 1: Create the Date Level Calcs
To start, let's show how to create the Date Level Calcs. We need to begin by creating a Parameter.

Here we are just created a simple String List Parameter with our different Date Level choices, year, quarter, month, week and day.
If you are wondering why those values are lower cased on the left....let's move onto the calcs!
[DateSwap]
DATETRUNC([Date Level],[Order Date])
By having the Parameters values be lower-cased, we don't have to write a CASE statement, or an IF/THEN statement, we can just throw it in a Datetrunc and save ourselves some time.
Step 2: Plot the Chart
This step is easy enough, Plot the DateSwap field on the Columns Shelf and choose Exact Date Continuous, this will make sure that we plot the marks on the correct places. Next, we want to change the Mark Type to Bar. You should see something like this.

Yikes! That doesn't look good at all.
So what's happening? Well the Parameter is set to Year, but the Date field is configured to be exact date, so we are only plotting 4 bars on a much larger axis.
How do we fix this? We could drag the Size all the way to the right, and get it looking a little better, but that doesn't solve the problem. We could also change the Size Mark to Fixed and set the units to 365, but that doesn't help us either since we will be changing Date Levels. So what do we do?
Step 3: The trick
Here is the trick, while writing http://www.datatableauandme.com/2017/12/how-to-density-scatter-plot-with.html I realized that we can set the Size Mark to be Fixed, and then could drag a Parameter onto the Size Mark, and it would make the units dynamic. I wonder if I could use a calc/field as well, and sure enough, you can!
Before we get into the calc, we need to talk what we are working with in Tableau. We know that the X-Axis is each day across the range of our data. As we change Date Levels, we plot the Bar Chart on the 1st day of the datelevel,i.e. Year would be January 1st, Month would be the 1st of the month, Week would be the 1st day of the week. Knowing this, we need to create a calculation that dynamically tells us how many days are in each of these levels, per each unit.
What does that mean? Not all Years have the same number of days, just like not all months have the same number of days. So we need a calc that will tell us how many days are in each unit as the datelevel changes.
[Size]
DATEDIFF('day', [DateSwap], DATEADD([DateLevel],1,[DateSwap]))
I thank my hours spent on Dates for this calc. Above finds the number of days in any year, quarter, month, etc by taking the Date difference in days from the date in question, and the next unit in line.
As you remember, [DateSwap] changes our dates to the level configured in the Parameter [DateLevel], so by taking that date, and 1 to the unit set, and then taking the difference in days, we can determine exactly how many days are in a particular year, quarter or month (or week and day even though those are static).
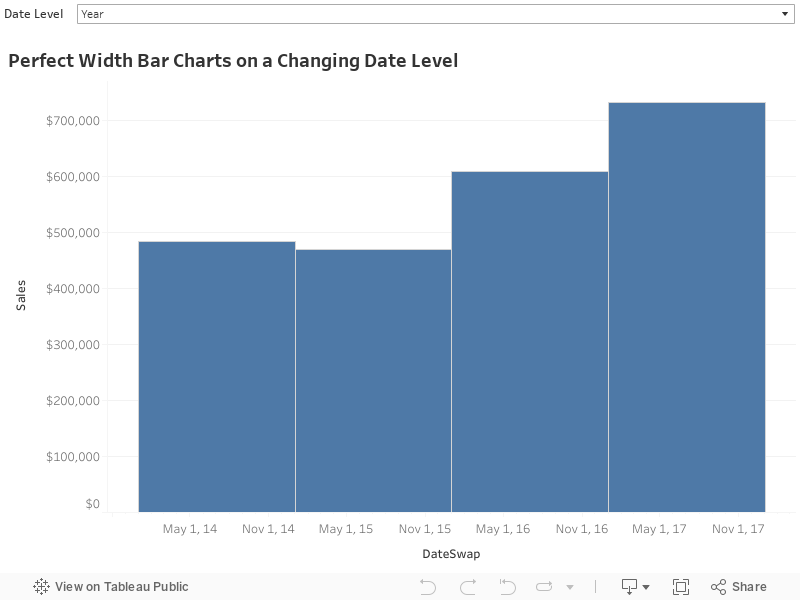
Once we have that calc, our job is super simple. Change the Size Mark to Fixed, and drag the Size calc onto the mark. It needs to be a Continuous Dimension for this trick to work properly!

And that's it!
You can expand on this however fits your needs. You can put Parameters on there for Marginal Histograms, or whatever other calcs you need, just make sure it's Continuous!
Now you can change Date Levels, and have pixel perfect width Bar Charts a long the way! Play around with the dashboard below.
1 Comment
Hey Rody, this is awesome! I was playing with it a bit and wanted to share the tooltip logic for the finishing touch. I did make one switch on the day to 'dayofyear' for my version. Happy New Year, my friend!
BalasCase [Date Level]
When 'year' then (DateName([Date Level],[Date Swap]))
When 'quarter' then 'Q'+(DateName([Date Level],[Date Swap]))
When 'month' then (DateName([Date Level],[Date Swap]))+'-'+STR(Year([Order Date]))
When 'week' then 'W'+(DateName([Date Level],[Date Swap]))
When 'dayofyear' then 'Day '+(DateName([Date Level],[Date Swap]))+' of the year'
END